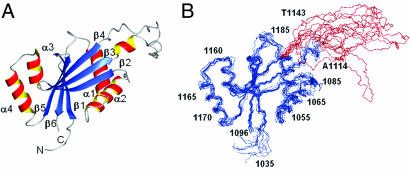
Fig. 2.
Structure of the N-domain in the presence of ATP. (A) Ribbon diagram of the structure with the α-helices shown in red-yellow and β-sheet in blue. (B) The backbone traces of the 10 lowest energy structures of the N-domain illustrating folded regions (blue) and the flexible loop Ala-1114-Thr-1143 (red).

