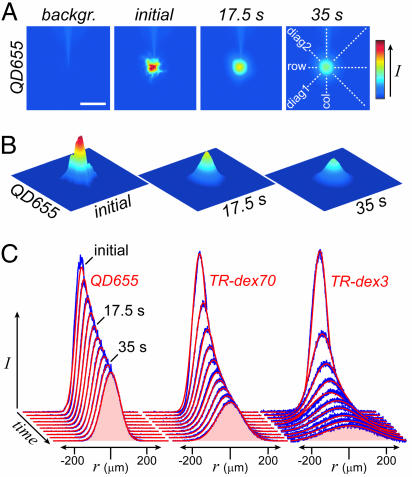
Fig. 2.
Free diffusion measurements. (A) Raw images obtained before (backgr.) and after ejection of QD655 into agarose. (Scale bar: 200 μm.) (B) Final images for analysis, shown in 3D representation, were obtained after subtraction of background fluorescence. (C) Fluorescence intensity profiles were extracted from each image along four axes (depicted in A at far right) and fit to the diffusion equation (see Materials and Methods). Representative data profiles (blue) superimposed with theoretical fits (red) are shown for QD655, TR-dex70, and TR-dex3 at 4.4-s intervals along the row axis. Fitting yielded the following values for D: 1.7 × 10⁻⁷ cm2·s−1, QD655; 4.3 × 10⁻⁷ cm2·s−1, TR-dex70; 2.3 × 10⁻⁶ cm2·s−1, TR-dex3.

