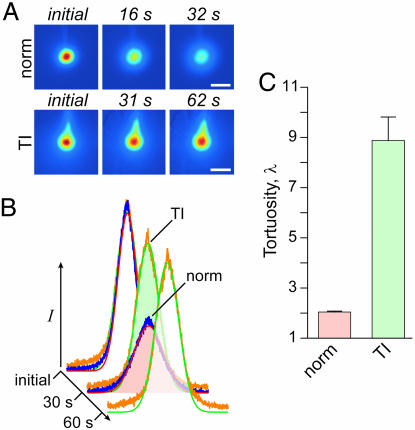
Fig. 6.
TR-dex3 diffusion is reduced in neocortex after terminal ischemia (TI). (A) Representative images after TR-dex3 ejection into normoxic (norm) cortex or 1 min after induction of TI. (Scale bars: 200 μm.) (B) Fluorescence intensity profiles and theoretical fits for the images in A yielding D* (norm) = 5.7 × 10⁻⁷ cm2·s−1 and D* (TI) = 3.4 × 10⁻⁸ cm2·s−1. (C) Values of λ (mean ± SEM) for TR-dex3 under the two conditions.

