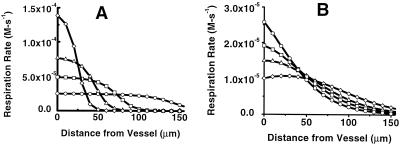
Figure 4.
Effects of increased tissue respiratory demand (work) on steady-state profiles of respiration. (A) Profiles in the absence of coupled NO/O2 diffusion. ○, The same as for Fig. 3D (VM = 2.5 × 10⁻⁵ Ms−1 for O2 consumption, which corresponds to 0.9 μmol O2 consumed/106 cell per h; ref. 20). □, ▵, and ◊, Results with increasing VM for oxygen (5 × 10⁻⁵ Ms−1, 8 × 10⁻⁵ Ms−1, 15 × 10−5 Ms−1, and 20 × 10−5 Ms−1, respectively). (B) Profiles with coupled NO/O2 diffusion. Symbols same as A. For both plots, the concentrations of NO and O2 at the vessel surface are 15 nM and 56 μM, respectively for the baseline condition (VM = 2.5 × 10⁻⁵ Ms−1).

