Fig. 1.
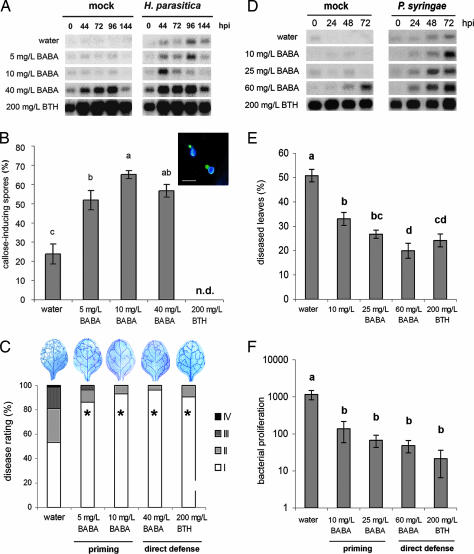
Chemical induction of priming and direct defense against H. parasitica WACO9 (A–C) and P. syringae pv. tomato DC3000 (D–F). Col-0 plants were soil-drenched with increasing concentrations of BABA or sprayed with BTH and pathogen-inoculated 2 days later. (A) PR-1 gene expression in 3-week-old control plants or BABA- or BTH-treated plants at different time points after inoculation. hpi, hours postinoculation. (B) Callose deposition 2 days after H. parasitica inoculation. (Inset) A representative example of H. parasitica spores triggering callose deposition in epidermal cells. (Scale bar, 20 μm.) n.d., not determined. (C) Induced resistance against H. parasitica at 8 days after inoculation. Asterisks indicate statistically different distributions of disease severity classes compared with the water control (χ2 test; α = 0.05). Colonization by the pathogen was visualized by lactophenol/trypan blue staining and light microscopy. (D) PR-1 gene expression in 6-week-old control plants or BABA- or BTH-treated plants at different time points after inoculation. (E) Induced resistance against P. syringae. Shown are means ± SEM (n = 15–20) of the percentage of leaves with symptoms at 3 days after inoculation. Different letters indicate statistically significant differences (least significant difference test; α = 0.05). (F) Growth of P. syringae over a 3-day time interval. Shown are means ± SD (n = 5–10). Different letters indicate statistically significant differences (least significant difference test; α = 0.05). All experiments shown were repeated with comparable results.

