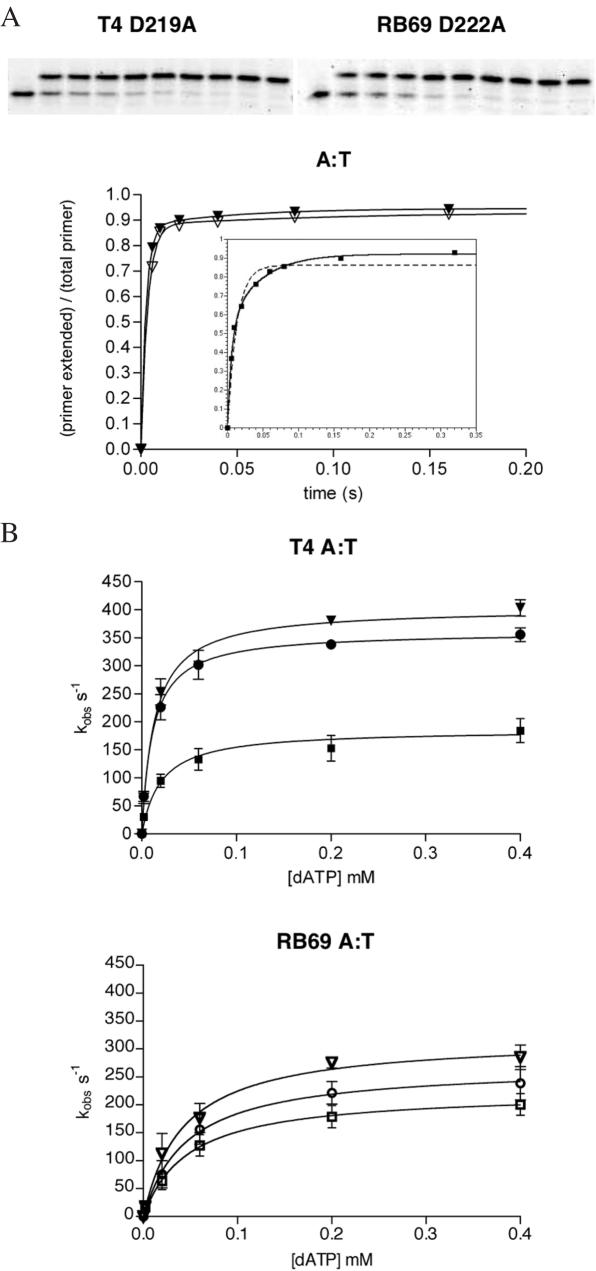
Figure 3.
Kinetic analysis of dAMP incorporation opposite a templating T. (A) Representative gels and progress curves are shown for the fastest mutants at the highest concentration of dATP used in the experiments (0.4 mM dATP) plotted against reaction time. These curves were best fit to a double exponential equation []. The inset shows the progress curve for the slowest T4 mutant (D324A) and a comparison between a double exponential curve fit (solid line) and a single exponential curve fit (dashed line). (B) Calculation of polymerase rate constants and dissociation constants for the incoming nucleotide. The observed, fast rate constants (kobs) for incorporation of A opposite T were plotted against dATP concentrations and fit to a hyperbola to give values for kpol and KD dATP for all three exonuclease mutants of T4 and RB69 DNA polymerases. (Closed triangle = T4 D219A, open triangle = RB69 D222A, closed circle = T4 D112A/E114A, open circle = RB69 D114A/E116A, closed square = T4 D324A, open square = RB69 D327A.).

