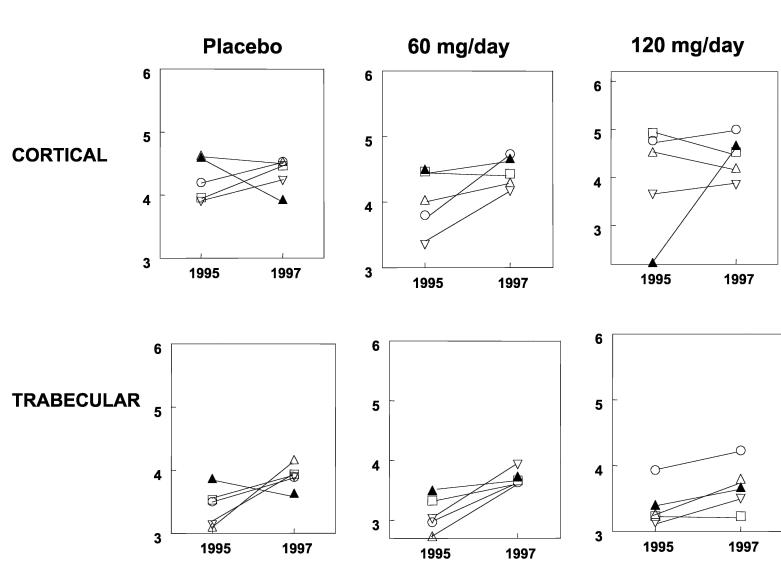
Fig 3.
Changes in mineral/matrix ratio in individual patients after two years of treatment with raloxifene is shown in this graph. The y-axis shows the mineral/matrix ratio (ratio of the integrated areas of the phosphate band to that of the amide I band) with each unique symbol in a given figure representing the same patient at baseline (1995) and 2 years after treatment (1997) for cortical and trabecular bone. The solid lines connect the baseline trabecular or cortical data to the 2-year time point for each patient.

