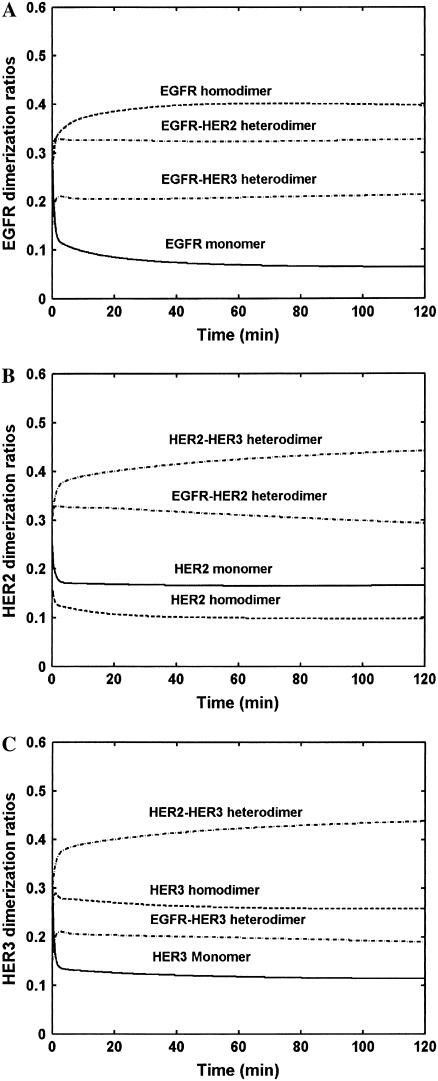
FIGURE 3.
Receptor dimerization hierarchy. The response of cell lines expressing 200,000 molecules each of EGFR, HER2, and HER3, exposed to saturating concentrations of both EGF and NRG, was simulated. The figure presents the fraction of the total receptor population of each type present as part of the specified type of monomer/dimer. The dimer type is indicated on top of each curve, while the receptor whose distribution is being analyzed is noted on the Y axis. The dimerization ratios were computed based on total receptor numbers present in the entire cell and therefore include receptors both at the plasma membrane and in the internal compartments. Dimerization patterns for (A) EGFR, (B) HER2, and (C) HER3 are presented.

