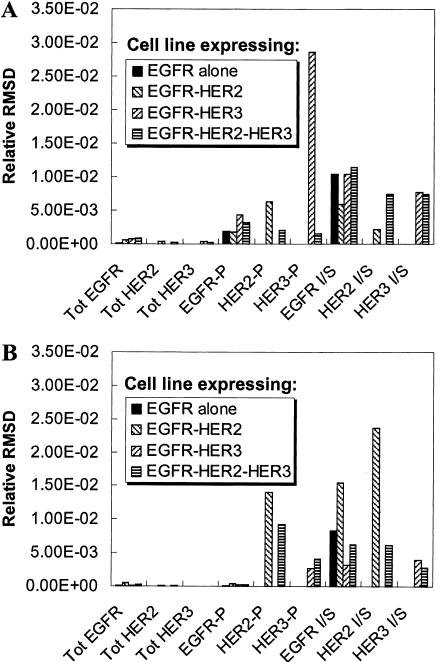
FIGURE 6.
Experimental design for parameter estimation. The model was run and the values of experimental observables were generated as a function of time using the base parameter set (base curves) and a parameter set with a 10% increase in a single model parameter (modified curves). The difference between the base curve and the modified curve was quantified using the relative root-mean-squared difference (RMSD) between the two curves (see the text). The experimental observables considered are the total receptor mass, the phosphorylation ratio, and the inside/surface ratio (denoted I/S in the figure) for the three receptors. The relative RMSD is plotted for these experimental outputs measured in four different cell lines for (A) a 10% change in parameter 13, the basal rate for the dissociation of EGFR homodimers; and (B) a 10% change in parameter 19, which is the enhancement in dimer dissociation rate when a receptor in a dimer becomes unphosphorylated. As seen, the fractional HER3 phosphorylation in a cell line expressing EGFR and HER3 would be the best output if one is interested in estimating parameter 13. Similarly, measurement of the HER2 In/Sur ratio in an EGFR-HER2 cell line provides the best estimate for parameter 19.

