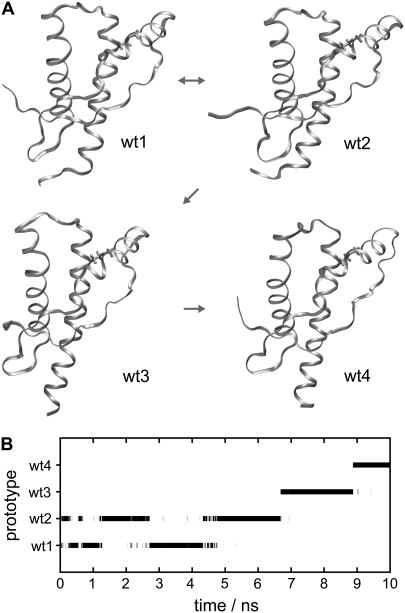
FIGURE 3.
(A and B) Conformations of wtPrP and time series of classifications. The structures of wt1, wt2, wt3, and wt4 are related to local density maxima in dihedral space. Thus, they represent classes of structurally similar configurations within the simulation time series of wtPrP. (A) The small arrows between the conformations indicate the chronological order in which they were occupied during the simulation. (B) The protein configurations sampled by the simulation of wtPrP are assigned to the classes defined by the prototypical configurations wt1–wt4.

