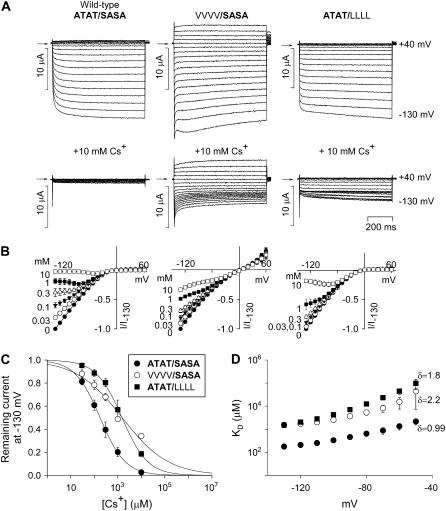
FIGURE 2.
Mutations at the base of the selectivity filter alter Cs+ block. (A) Typical current traces recorded during voltage pulses from −130 to +40 mV from wild-type (ATAT/SASA) and Kir3.1-A-142V/Kir3.4-T-148V (VVVV/SASA) and Kir3.1-S-166L/Kir3.4-A-172L (ATAT/LLLL) mutant channels. Currents were recorded in the absence (top) and presence (bottom) of 10 mM Cs+. Arrows indicate zero current. (B) Mean normalized current-voltage relationships for each channel in the presence of a range of Cs+ concentrations. (C) Dose-response curves for Cs+ block at −130 mV of each channel (indicated in inset). (D) Mean KD for Cs+ block versus membrane potential for each channel (indicated in inset in C). The value of δ, the apparent fraction of the electrical field that Cs+ must cross to reach its blocking site, for each channel is shown. Mean ± SE shown (n = 5–6).

