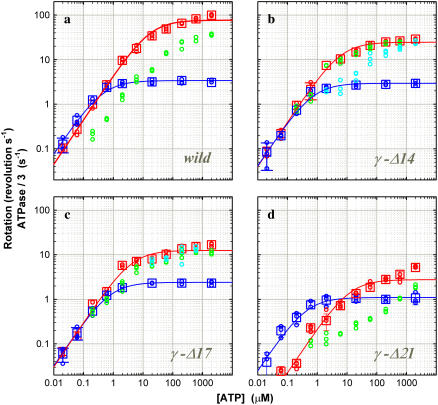
FIGURE 4.
Comparison of hydrolysis and rotation rates. (a) Wild-type; (b) γ-Δ14; (c) γ-Δ17; and (d) γ-Δ21. For comparison with rotation, hydrolysis rates are divided by three. Circles are from individual time courses, and squares show the average over three points, error bars being a standard deviation larger than the size of the square. [F1] was 5 nM except at 60 and 20 nM ATP, where [F1] was 10 nM. (Cyan) The initial hydrolysis activity estimated at 2–7 s after mixing (2 μM ATP and above), 2–15 s (600 and 200 nM ATP), or from the entire 360-s portion (60 and 20 nM ATP; 200 and 60 nM ATP for γ-Δ21). Values at 60 and 20 nM ATP have been corrected for a small decline in absorbance observed in the absence of F1. (Green) The steady-state hydrolysis activity estimated from the final 200-s portion of a time course; not estimated at 60 and 20 nM ATP (and 200 nM ATP for γ-Δ21) where the activity was low from the beginning. (Red) The maximal hydrolysis activity in a time course: it was equal to the initial activity in the wild-type and γ-Δ21; in γ-Δ14 and γ-Δ17 at intermediate [ATP]s, the maximal activity was observed after an initial lag, and its value was estimated as a slope over a 5-s interval. (Blue) Rotation frequency estimated over >7 consecutive revolutions (see Fig. 3). Red and blue curves show a fit with Michaelis-Menten kinetics: V = Vmax [ATP]/(Km + [ATP]). For hydrolysis (red), Vmax (not divided by three) and Km are 230 s−1 and 17 μM (wild), 75 s−1 and 6.1 μM (γ-Δ14), 38 s−1 and 4.1 μM (γ-Δ17), 8.3 s−1 and 12 μM (γ-Δ21); for rotation (blue), 3.4 s−1 and 0.43 μM (wild), 2.9 s−1 and 0.70 μM (γ-Δ14), and 2.4 s−1 and 0.73 μM (γ−Δ17), 1.1 s−1 and 0.43 μM (γ-Δ21).

