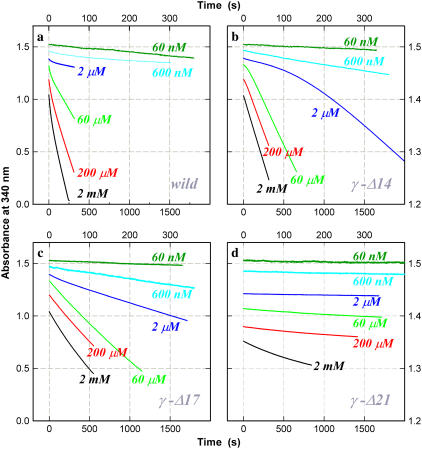
FIGURE 7.
Time courses of ATP hydrolysis at indicated [ATP]. (a) Wild-type; (b) γ-Δ14; (c) γ-Δ17; and (d) γ-Δ21. The decrease in absorbance is proportional to the amount of ATP hydrolyzed. Top and right axes apply to curves for 600 nM and 60 nM ATP. The wild-type showed an initial high activity followed by a steady-state activity (constant slope). At [ATP] ∼10 μM, a low-activity phase appeared before reactivation to the final steady state (see 60 μM). Mutant γ-Δ14 showed an initial lag at and above 2 μM ATP. This was less conspicuous with γ-Δ17, for which a slight initial lag was observed between 600 μM and 20 μM ATP (not clear on the chosen timescale). The activity of γ-Δ21 was very low and was characterized by an initial activity followed by a lower steady-state activity. To avoid overlap, the curves are vertically shifted by an arbitrary amount. [F1] = 5 nM except at 60 nM ATP where [F1] = 10 nM.

