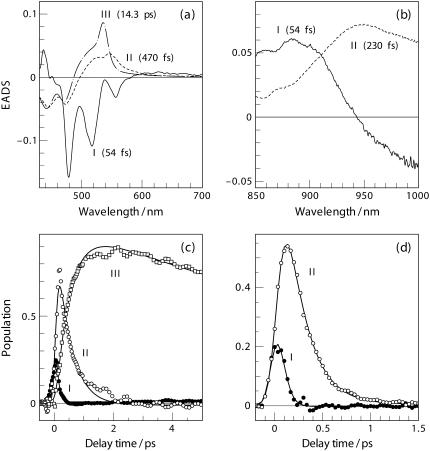
FIGURE 3.
EADS and excited-state population derived from the SVD-Global analyses to the time-resolved spectra in Fig. 2 in the visible (a and c) and in the NIR (b and d) regions. Ordinal numbers indicate the order of transient species involved in the sequential kinetics model I → II → III. Lifetimes associating to the EADS components are given in parentheses.

