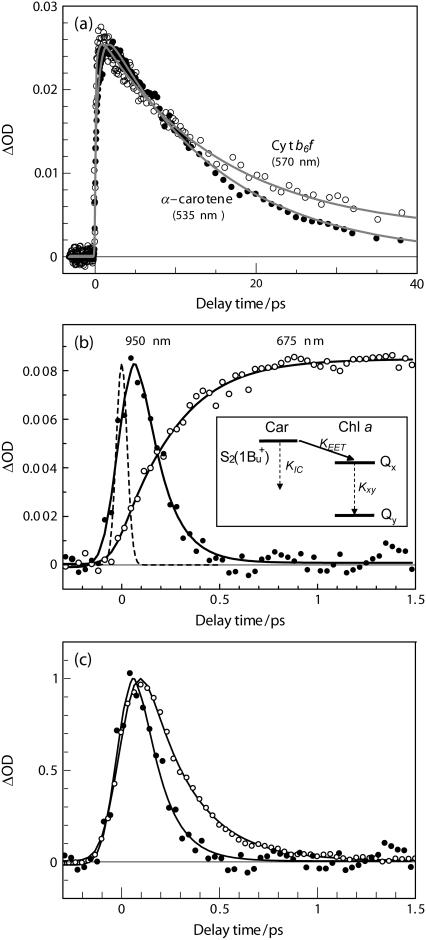
FIGURE 6.
(a) Comparison of the kinetics trace at 570 nm for the Cyt b6f complex from B. corticulans with that at 535 nm for α-carotene in n-hexane. (b) Kinetics traces at 675 nm (inverted and normalized by multiplying by a factor of −0.4) and at 950 nm plotted from the original time-resolved spectra (Fig. 5). They were simultaneously fit to a kinetic model depicted in the inset (KIC and Kxy stand for the rate of internal conversion of α-carotene and Chl a, respectively, KEET for the rate of energy transfer). In this scheme, the S2(1Bu+) state is configurationally relaxed. The solid line presents fitting curve; the dashed line shows a Gaussian-type instrumental response function. (c) Comparison of the kinetics traces at 950 nm for α-carotene in n-hexane (open circle) and for the Cyt b6f complex from B. corticulans (solid circle).

