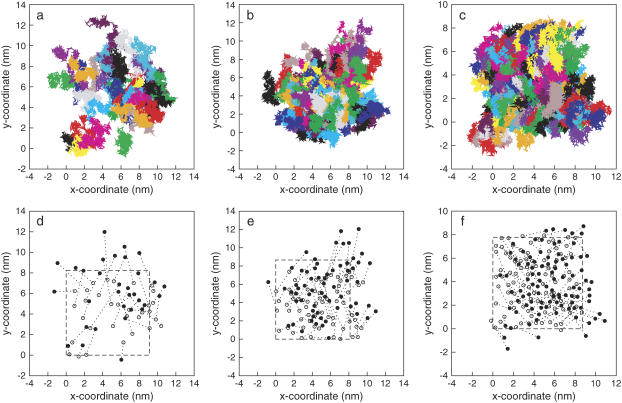
FIGURE 14.
Lateral movement of phosphorus atoms in DPPE along the xy-plane on one of the leaflets in (a) Lipid-B, (b) Lipid-C, and (c) Lipid-D systems. Each color represents one DPPE molecule. For clarity, the corresponding initial (open circles) and final (solid circles) positions of phosphorus atoms are shown in d, e, and f. Outline of the final simulation box dimension is shown as dash-line. Coordinates are plotted without periodic boundary conditions.

