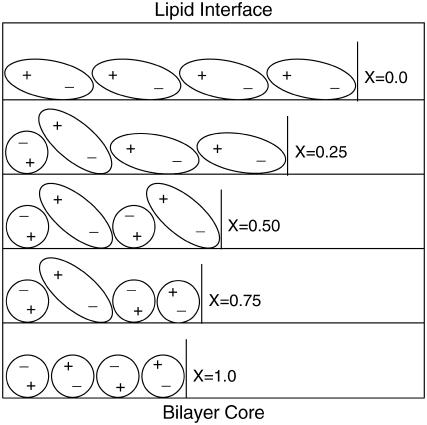
FIGURE 15.
Schematic of the arrangement of the DPPC and DPPE headgroups in the bilayer. DPPC and DPPE are represented as ovals (large headgroup) and circles (small headgroup), respectively. The plus-symbol represents the charge in the choline or amine group, and the minus-symbol the charge in the phosphate group. Orientation of the bilayer and DPPE mole fraction are shown in the figure. Water and lipid tails are excluded for clarity.

