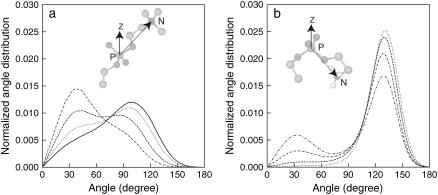
FIGURE 9.
Normalized angle distribution for P-N vector for (a) DPPC in Lipid-A to Lipid-D and (b) DPPE in Lipid-B to Lipid-E. Angle is measured with respect to the normal of the bilayer surface (z-axis). Lipid systems are represented by the following lines: solid (Lipid-A), dot (Lipid-B), dash (Lipid-C), dot-dash (Lipid-D), and dot-dot-dash (Lipid-E). Pictorial representation for P-N vector is shown in the figure.

