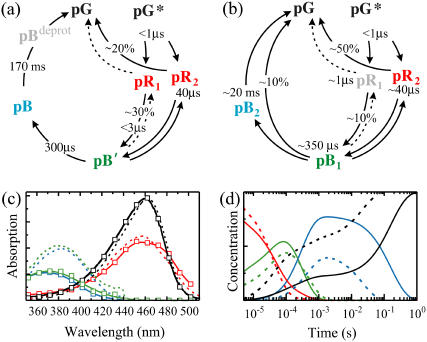
FIGURE 4.
Results of the target analysis of the E-46Q mutant of PYP in solution and in the crystalline state. (a) Kinetic scheme of the photocycle of the protein in (dilute) solution. (b) Kinetic scheme of the photocycle of the protein when present in a crystalline lattice. (c) Absorption spectra of the intermediate states. (d) The temporal evolution of the concentration of each intermediate state. The dashed lines in a and b refer to processes for which no reliable quantitative estimates of rates and amplitudes could be obtained. The solid and dashed lines in c and d represent the solution and the crystalline lattice data, respectively. The open squares in c represent the actual experimental data points of the solution data, whereas the solid lines guide the eye. The states in light color have not been characterized in this study. Color code in c and d: black, pG; red, pR; blue, pB′; and purple, pB.

