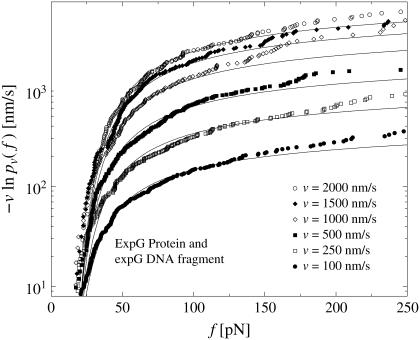
FIGURE 4.
Same symbols as in Fig. 3 but for dynamic AFM force spectroscopy data by Bartels et al. (23) for the dissociation of the DNA fragment expG1/G4 from the regulatory protein ExpG. (Symbols) The functions  for different pulling velocities υ, obtained according to Eq. 4 and taking into account only fn above fmin = 10 pN. (Solid lines) Theoretical functions
  for the same pulling velocities υ as the symbols, using Eqs. 9, 11–16, and 20.

