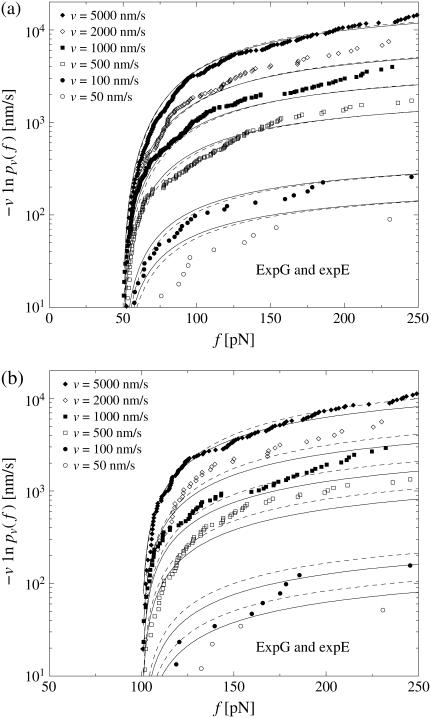
FIGURE 8.
Same as in Fig. 3 except that in panel a, only fn above fmin = 50 pN and in panel b, only fn above fmin = 100 pN have been taken into account. The solid lines are the corresponding theoretical functions  using Eqs. 9, and 11–19. (Dashed lines) Same as solid lines but after refitting the parameters k0, αm, and σ to the given data subset, resulting in k0 = 0.000020 s−1, αm = 0.19 pN−1, σ = 0.095 pN−1 for panel a, and in k0 = 0.017 s−1, αm = 0.091 pN−1, σ = 0.040 pN−1 for panel b.

