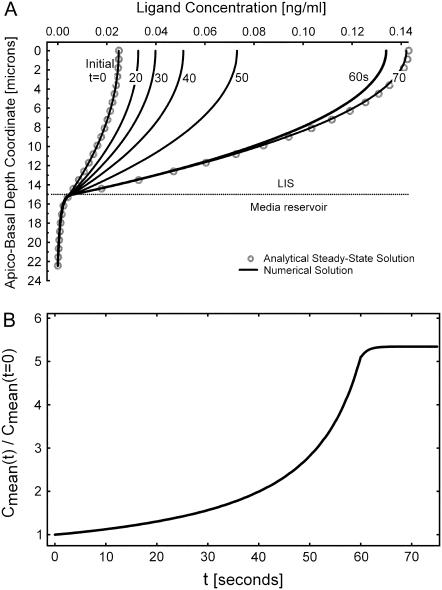
FIGURE 2.
Solutions obtained by solving for the ligand concentration from the governing diffusion-convection equations. (A) Evolution of the time-dependent concentration profile during a LIS collapse to 15% of its original width (from 1.5 to 0.225 μm) over 60 s. Concentration is plotted versus the apico-basal depth coordinate, where x = 0 at the apical tight junction, x = 15 at the LIS boundary, and at a depth of 22.5 μm the concentration is zero. The corresponding finite element model is shown in Fig. 1. For comparison, the open circles represent the analytical steady-state solution before LIS collapse and upon reaching the new, after-collapse steady state. The numbers next to the curves indicate seconds after onset of collapse. (B) Concentration profiles from panel A are plotted as fold-mean concentrations: Cmean(t)/Cmean(t = 0). Here,  , h is the LIS depth equal to 15 μm, and Cmean(t = 0) is the mean LIS ligand concentration just before the change in LIS width.

