FIGURE 5.
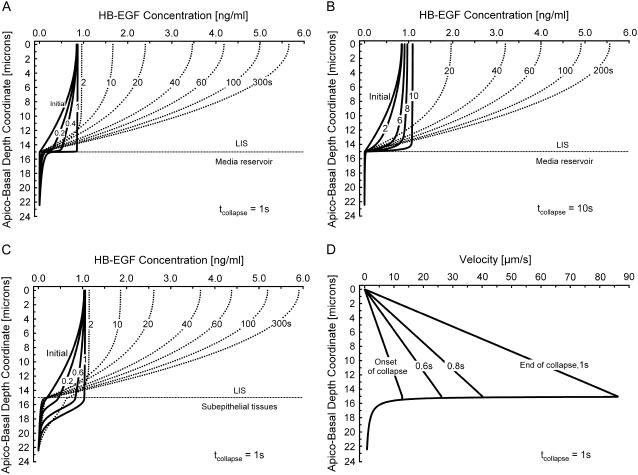
(A) Evolution of concentration profiles (each curve is labeled with its corresponding time) for a 1-s linear collapse (see Fig. 4 C) for the in vitro case where DLIS = 1.8 μm2/s and Dout = 75 μm2/s, LIS height h = 15 μm (boundary between LIS and underlying media), and concentration is assumed zero at 7.5 μm below the LIS boundary. Solid lines indicate times when the LIS width is changing (number next to curve represents the time in seconds corresponding to the profile), and dotted lines represent times after the LIS has reached its new steady-state geometry. (B) Concentration profiles for a 10-s linear collapse (see Fig. 4 C) for the in vitro case with the same parameters as in panel A. (C) Evolution of concentration profiles for a one-second linear collapse for the in vivo case where DLIS = Dout = 1.8 μm2/s. The geometry is the same as that described in panel A. (D) Velocity profiles corresponding to panel A.

