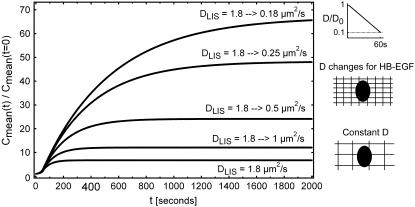
FIGURE 8.
Fold change in mean concentrations for various geometry-dependent changes in diffusion coefficients during LIS collapse. All cases are for a 60-s LIS collapse where the LIS width decreases to 15% of its initial, precollapse value (from 1.5 to 0.225 μm, Fig. 4 C). The case of constant HB-EGF diffusion coefficient DLIS = 1.8 μm2/s is shown as the bottom curve. In the other four cases, we assume that the collapsing LIS causes a linear decrease (after LIS geometry) in HB-EGF diffusion coefficient during the 60-s collapse. For example, the top curve DLIS = 1.8 → 0.18 μm2/s indicates the case where the diffusion coefficient changes linearly over 60 s from the initial value of 1.8 μm2/s to the final value of 0.18 μm2/s (see side panel). In the other three cases of decreasing DLIS, the diffusion coefficient linearly decreases over 60 s from 1.8 to 0.25, 0.5, and 1 μm2/s. The side schematics illustrate how the shrinking volume of the LIS could considerably amplify the effect of hindered diffusion caused by size and charge interactions of ligands with the glycocalyx.

