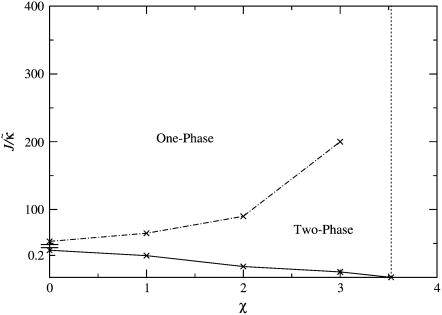
FIGURE 4.
 versus χ phase diagram for
  , lu0 = 36, ls0 = 54, δlmax = 1.0, nr = 1, L = 50, φu = φs, and simulation time t = 131,072 MC cycles. The crosses (×) are simulation data marking the approximate boundaries of the two-phase regime. The dashed-dotted line marks the upper phase boundary between the one- and two-phase regimes, where the position of this line depends on the system size. The dotted line is predicted behavior and is only schematic. For χ > χc = 3.526 (dashed line), phase separation will occur regardless of the value of J. For comparison purposes between the phase diagram shown here and the phase diagram in Fig. 3, the lower phase boundary for χ = 0 occurs at
  , while the upper phase boundary occurs at
  .
.

