
Figure 2. Kaplan-Meier Curves for Disease-free Survival According to ER Status in the Three Studies.
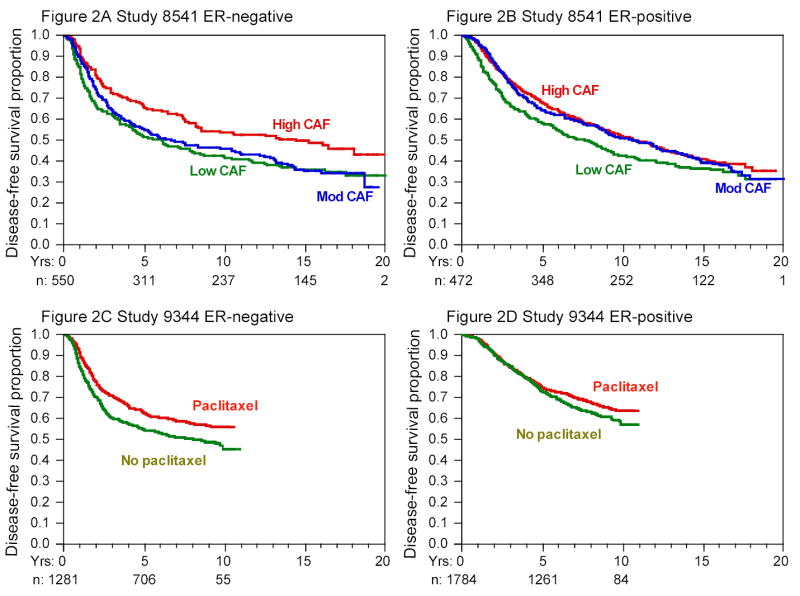
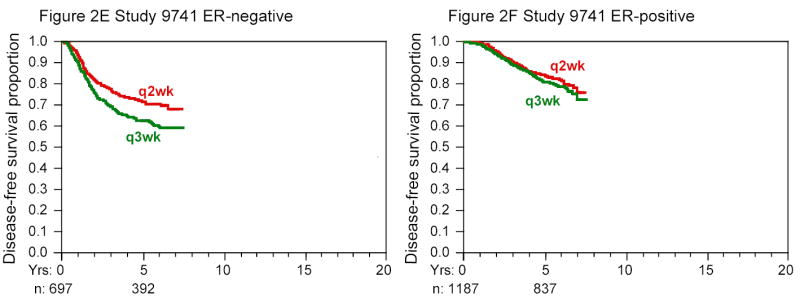
Cumulative at-risk sample sizes over time are shown in each panel. The initial sample sizes were approximately equally divided among the groups in question. The dose effect of doxorubicin in study 9344 and the comparison of sequential or concurrent therapy in study 9741 are not shown; neither factor was associated with disease-free survival in unadjusted or adjusted analyses, nor were there significant differences within ER subgroups.