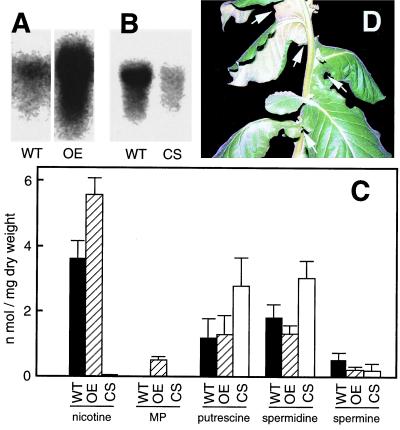
Figure 3.
Analyses of transgenic N. sylvestris plants with altered PMT expression levels. (A and B) RNA gel blot analysis of PMT gene expression. Ten micrograms of total RNA isolated from the root was loaded in each lane and probed with antisense tobacco PMT RNA. Equal loading of samples was confirmed by ribosomal RNA staining. WT, wild type; OE, PMT-overexpressing plant; CS, PMT-cosuppressing plant. (C) Leaf contents of nicotine and polyamines. MP, N-methylputrescine. (D) Phenotype of PMT-cosuppressing plants. Neighboring leaves are fused in their basal regions (arrows), forming a continuous spiral sheet along the stem.

