Figure 4.
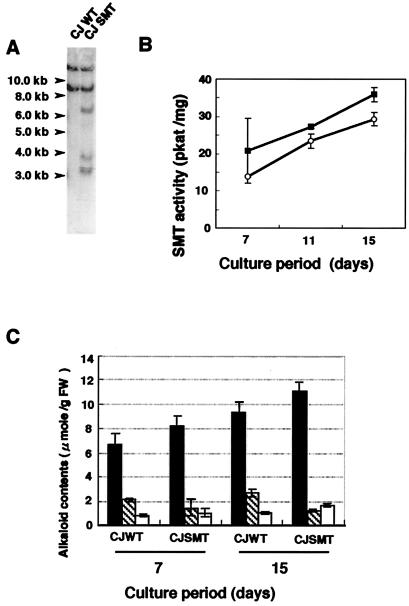
SMT activity and alkaloid profile in transformed Coptis cells. (A) Genomic DNA analysis. Genome DNAs were digested with HindIII and detected with a PCR-amplified SMT fragment probe. (B) SMT activity in transgenic Coptis cells. Closed square, SMT transgenic cells (CJSMT); open circle, wild-type cells (CJWT). (C) Alkaloid contents in transgenic Coptis cells. Closed bar, berberine; hatched bar, coptisine; open bar, columbamine. Each value is the average of triple measurements.

