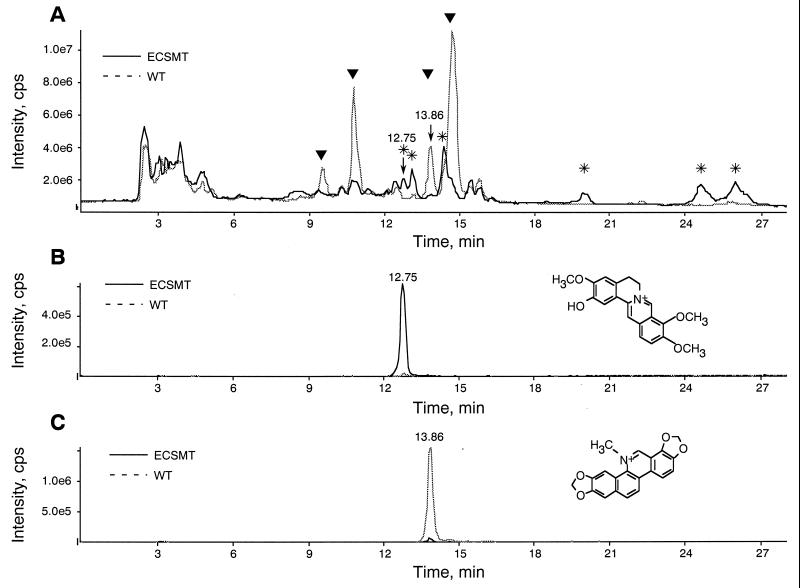
Figure 6.
LC-MS analysis of metabolites in transgenic E. californica cells with Coptis SMT. (A) Total ion chromatogram of extracts of wild-type and transgenic E. californica cells. (B) Chromatogram of the columbamine ion (m/z 388) in wild-type and transgenic E. californica cells. (C) Chromatogram of the sanguinarine ion (m/z 332) in wild-type and transgenic E. californica cells. Dotted line, wild type; solid line, transgenic plant. The peaks of columbamine (time, 12.7 min) and sanguinarine (time 13.8 min) are indicated by arrows. *, Peaks that increased in intensity in transgenic cells; closed triangle, peaks that decreased in intensity in transgenic cells.

