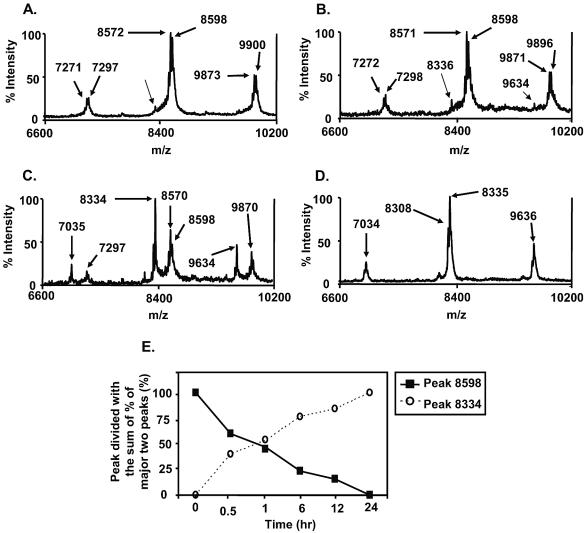
FIG. 1.
Mass spectra of PnLTA (250 μg/ml) before reaction with PAF-AH (A) and after reaction for 2 h with different concentrations of PAF-AH (0.5, 5, and 10 μg/ml) (B, C, and D, respectively). The peak heights are shown as percent intensity, which indicates the relative percentage of each peak height to the tallest peak height in each spectrum. The positions of various prominent peaks are shown. (E) Heights of the peaks at 8,598 and 8,334 m/z units at various times. The x axis indicates the number of hours that LTA was incubated with PAF-AH at 37°C.

