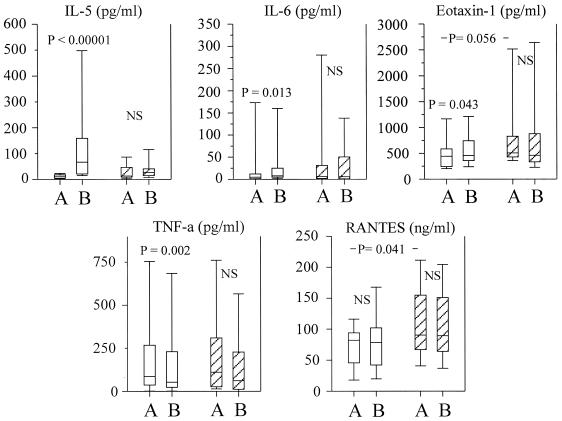
FIG. 4.
Plasma cytokine levels before treatment (bleed A) and 24 h posttreatment (bleed B) in high-eosinophil responders (n = 33; open boxes) and low-eosinophil responders (n = 18; hatched boxes). The boxes represent the 25th, 50th, and 75th percentile ranges, and the error bars show the ranges of the 10th and 90th percentiles.

