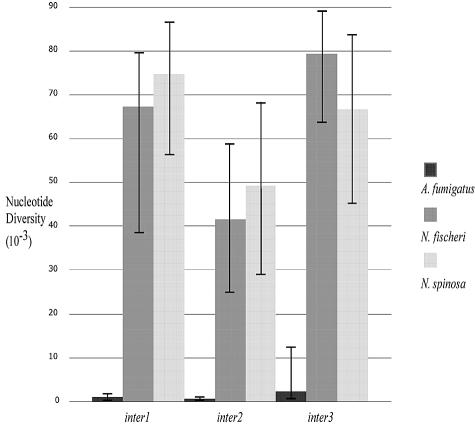
FIG. 3.
Nucleotide diversity for three intergenic regions in A. fumigatus, N. fischeri, and N. spinosa. Thick bars represent estimates of nucleotide diversity based on pairwise sequence comparisons. Thin bars indicate ranges of error represented by the approximate 95% confidence intervals for this estimate, determined by Monte Carlo simulation of the coalescent process.

