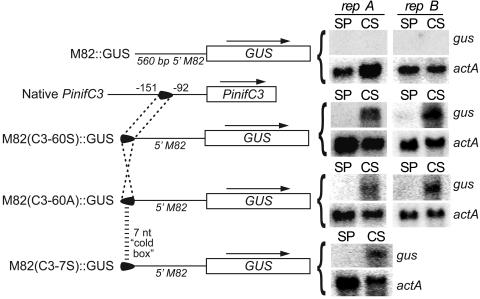
FIG. 4.
Analysis of chimeric promoters. Shown on the left are, top to bottom, schematics of the M82 promoter fused to GUS; PinifC3, including the 60-nt region; a fusion between GUS, the M82 promoter, and the 60-nt region in the sense orientation; a fusion between GUS, the M82 promoter, and the 60-nt region in the antisense orientation; and a fusion between GUS, the M82 promoter, and the 7-nt cold box. On the right are blots of RNA from representative strains transformed with each plasmid (repA and repB), using the same tissues and probes as in Fig. 2.

