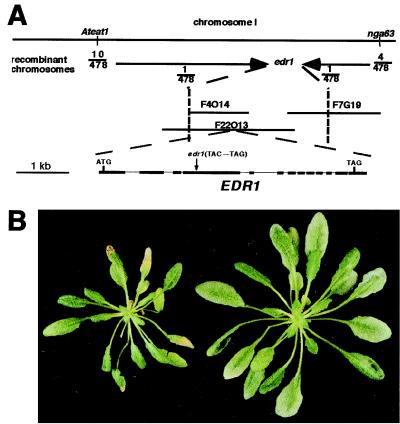
Figure 2.
Positional cloning of the EDR1 gene. (A) Genetic and physical map of the region flanking EDR1. The vertical dotted lines indicate the position of the closest markers that defined the edr1 genetic interval. Sequencing of three candidate genes in this interval revealed a C→G transversion in gene F22013.21, which produced an early stop codon. Comparison of the genomic sequence to the cDNA sequence obtained by reverse transcription–PCR revealed the indicated exon (boxes)-intron (lines) structure. (B) Complementation of the edr1 mutation by Agrobacterium-mediated transformation. Shown are sibling plants from the T2 generation that lack the wild-type EDR1 transgene (Left) or that contain the EDR1 transgene (Right). The apparent difference in size is because of necrosis of the larger leaves in the edr1 mutant (resistant) plant.

