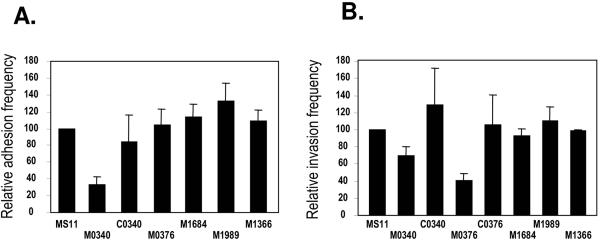
FIG. 3.
Interaction of N. gonorrhoeae mutants with A431 cells. (A) Adherence to A431 cells. Adhesion data are presented as relative adhesion frequency, normalized to the wild-type control (MS11), which was arbitrarily set at 100%. (B) Invasion of A431 cells. Invasion data are presented as relative invasion frequency, normalized to MS11, which was arbitrarily set at 100%. These data are averages from three independent experiments performed in triplicate, and error bars indicate standard deviation.

