FIG. 2.
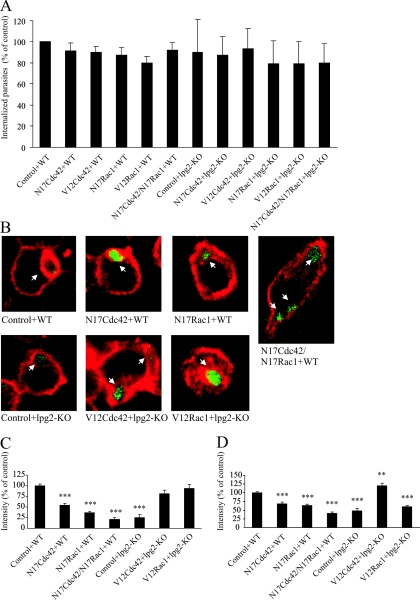
F-actin around phagosomes and cortical F-actin in cells with dominant negative or constitutively active Cdc42 and Rac1. RAW264.7 macrophages were transduced with TAT-linked N17Cdc42, N17Rac1, N17Cdc42/N17Rac1 in combination, TAT-V12Cdc42, or TAT-V12Rac1. Controls were treated with buffer. Thereafter, the cells were challenged with GFP-expressing WT L. donovani or LPG-defective mutants (lpg2−/− KO). (A) For flow cytometry, the cells were trypsinized and fixed after infection. The data obtained in three independent experiments represent cells positive for GFP fluorescence and are expressed as means normalized to the WT controls. (B to D) For microscopy, the cells were fixed, labeled with AlexaFluor 594-phallacidin, and imaged in a confocal microscope. Representative images of phalloidin-stained RAW264.7 macrophages infected with L. donovani are shown in panel B. F-actin was measured by manually tracing the rim of F-actin around randomly scanned phagosomes (101 to 338 measured phagosomes from duplicate preparations and at least three independent occasions) (C) or the F-actin at the cell periphery (50 to 75 measurements from duplicate preparations and three independent occasions) (D). Shown are the mean values of the median intensity of individual traces. The results in panels C and D were normalized against data from control cells with WT L. donovani. Error bars are SEM.

