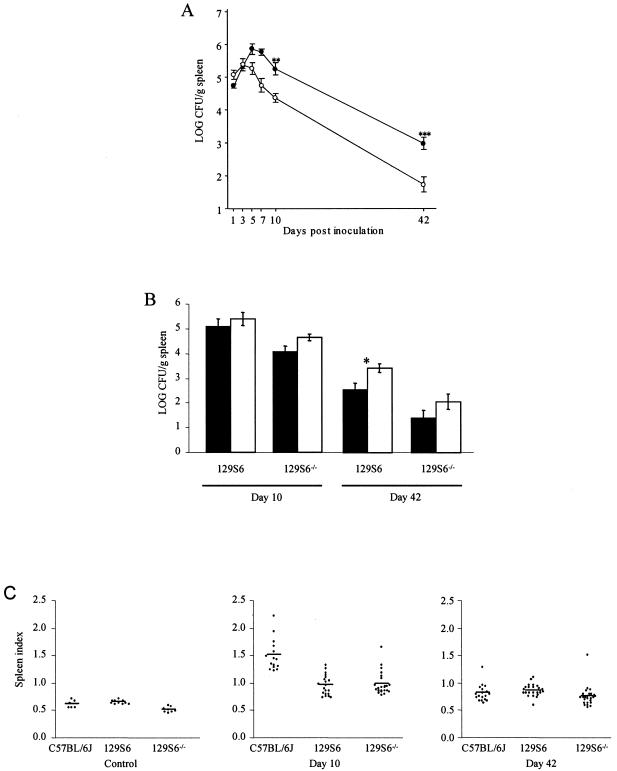
FIG. 1.
(A) Kinetics of infection in inbred mice following administration of a sublethal inoculum of S. enterica serovar Enteritidis. Black and white circles represent groups of four to six 129S6 and 129S6-Slc11a1tm1Mcg mice, respectively, that were sacrificed at different time points following intravenous infection with 1,000 CFU of S. enterica serovar Enteritidis strain 3b. The experiments were done in triplicate. The data are the average log CFU per gram of spleen ± the standard error of the mean. Asterisks represent the significance levels of the difference in the numbers of Salmonella CFU between the two strains of mice (**, P < 0.01; ***, P < 0.001). (B) Graphic representation of Salmonella carriage in female (black columns) and male (white columns) 129S6 and 129S6-Slc11a1tm1Mcg (129S6−/−) mice at days 10 and 42 following a challenge with S. enterica serovar Enteritidis. The asterisk represents the significance levels of the differences in Salmonella carriage between the female and male mice (P < 0.05). (C) Scatterplots demonstrating the spleen indexes of C57BL/6J, 129S6, and 129S6-Slc11a1tm1Mcg (129S6−/−) control mice and mice infected for 10 and 42 days with S. enterica serovar Enteritidis. The experiments were done in triplicate, and each dot represents an animal.

