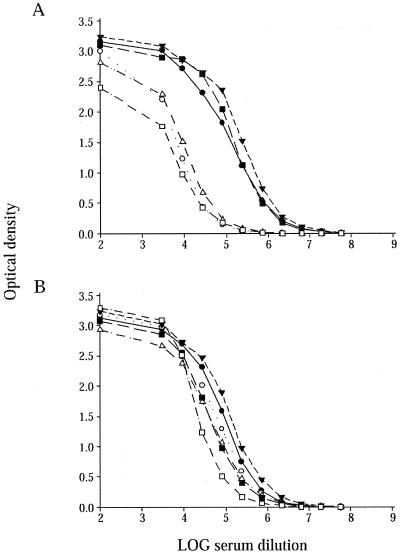
FIG. 6.
S. enterica serovar Enteritidis-specific IgG2a antibody levels of individual female (A) and male (B) mice 42 days after infection. Black and white symbols represent the log of the antibody concentrations in the sera of infected 129S6 and 129S6-Slc11a1tm1Mcg mice, respectively. The experiments were done in duplicate, and each line represents the average log antibody concentration value obtained for one mouse.

