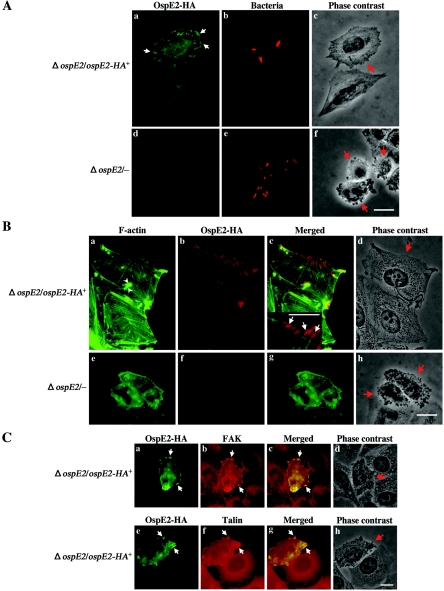
FIG. 3.
OspE2-HA accumulates at focal contact-like structures in infected cells. (A) HEp2 cells were infected with S. sonnei MS1303/pMM819K (ΔospE2/ospE2-HA+) or MS1303/pK19 (ΔospE2/−). After 3 h, the cells were fixed and immunostained. OspE2-HA was stained with anti-HA monoclonal antibody and secondary fluorescein isothiocyanate-tagged antibody. Bacterial cells were stained with anti-S. sonnei form I antibody and secondary Texas Red-tagged antibody. Single-color and phase-contrast images are shown for each strain. White arrows indicate the sites of accumulation of OspE2-HA signals. Red arrows in panels c and f indicate host cells with invaded bacteria. Scale bar, 10 μm. (B) HEp2 cells were infected with S. sonnei MS1303/pMM819K (ΔospE2/ospE2-HA+) or MS1303/pK19 (ΔospE2/−) for 3 h and then subjected to immunofluorescence staining. F-actin was stained with Alexa 488-labeled phalloidin; OspE2-HA was stained with anti-HA monoclonal antibody and secondary Texas Red-tagged antibody. Single-color, merged, and phase-contrast images are shown. Actin stress fibers terminate at the site of OspE2-HA signals (white arrows in the inset of panel c). Red arrows in panels d and h indicate the infected cells. Scale bars represent 10 μm for panels d and h and 5 μm for the inset in panel c. (C) HEp2 cells infected with S. sonnei MS1303/pMM819K (ΔospE2/ospE2-HA+) for 3 h were stained with antibody against FAK (red) or talin (red) and OspE2-HA (green). Single-color, merged, and phase-contrast images are shown. White arrows indicate focal contact-like structures. Red arrows in panels d and h indicate infected cells. Scale bar, 10 μm.

