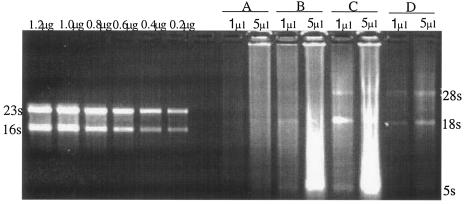
FIG. 1.
Quantification of extracted RNA. One- and 5-μl portions of a total of 100 μl were separated by electrophoresis on a 2% agarose gel stained with ethidium bromide alongside 0.2 μg, 0.4 μg, 0.6 μg, 0.8 μg, 1.0 μg, and 1.2 μg of E. coli 23S/16S rRNA standards. Sections A to D represent RNA samples of four different subjects; the 28S, 18S, and 5S ribosomal bands are indicated.

