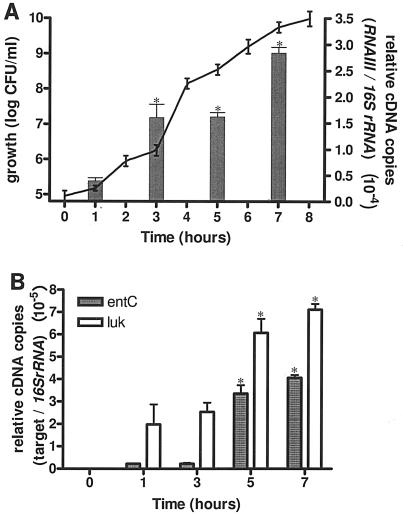
FIG. 3.
(A) Growth curve (line graph) and transcription profile (bar graph) of RNAIII and (B) temporal regulation of luk and entC in S. intermedius (strain 3) from early exponential to post-exponential phase of growth. The expression level of each sample was normalized to that of S. intermedius 16S rRNA signal. Values that were significantly different compared to the respective control value at 0 h (P < 0.05) are indicated by asterisks. Values are means ± standard errors of the means (error bars) (n = 3).

