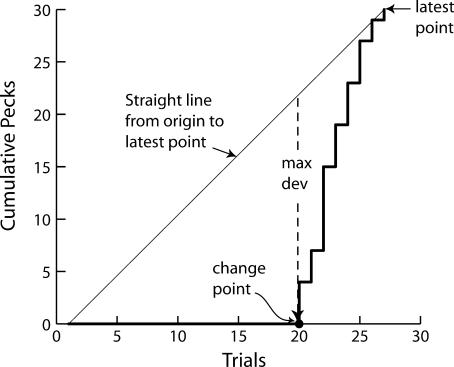
Fig 3. An illustrative cumulative record of 27 trials (taken with permission from Gallistel, Fairhurst, & Balsam, 2004).
No pecking occurred up to Trial 20. The change-point detection algorithm was applied iteratively to each successive point in the cumulative record, drawing in effect a straight line (not shown in the picture) from the point of origin up to that point. When it reached Trial 27, it drew the straight line indicated in the graph by the slanted dashed line. The point where the cumulative record deviates maximally from this straight line is between Trial 19 and 20. This point is identified as a putative change point. It divides the record into two portions: the cumulative pecks of the trials up to and including Trial 19, and the cumulative pecks of Trials 20 to 27. The distribution of pecks per trials for the trials before and after the putative change point are compared, using an appropriate statistical test. If they differ significantly, the putative change point is accepted as valid. Then the algorithm begins over again, taking Trial 19 as the origin (zero point of the cumulative record) and the pecks on Trial 20 as the first datum (first measurement in the postchange cumulative record).

