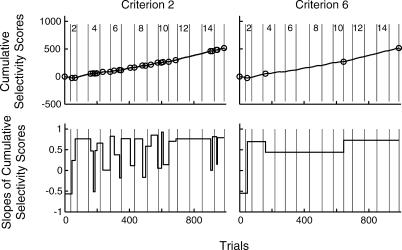
Fig 4. Upper panels: Cumulative records of the selectivity scores for the same mouse (M339) shown in Figure 1, with the change points indicated by the superposed circles.
Lower panels: Step plots of the slopes of the cumulative records between successive change points. On the left, a liberal criterion was used in the finding of change points (logit = 2); on the right, a conservative criterion (logit = 6) was used.

