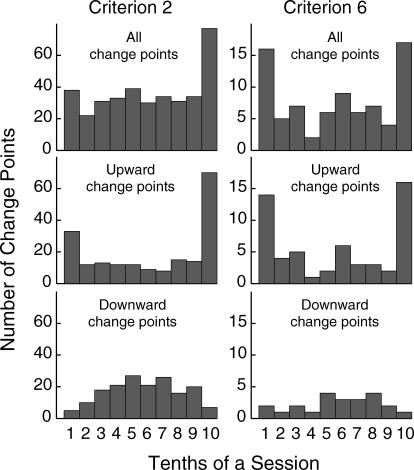
Fig 7. Histograms of the distribution of selectivity-score change points within a session for the mice of all groups (change points from all sessions have been pooled in the histograms).
The upper panel shows all change points. The middle and lower panels show upward and downward change points respectively. The left panels show Criterion-2 analyses, and the right panels show Criterion-6 analyses.

