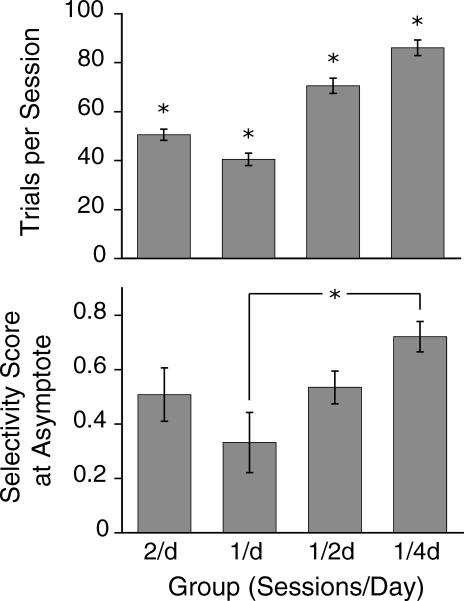
Fig 9. Upper graph: mean number of trials per session for each group (1/4d > 1/2d > 1/d & 2/d, p < .001).
Bottom graph: mean selectivity score during asymptote for each group (1/4d > 1/d, p = .04). The error bars represent standard error of the means. Significant differences are denoted with an asterisk.

