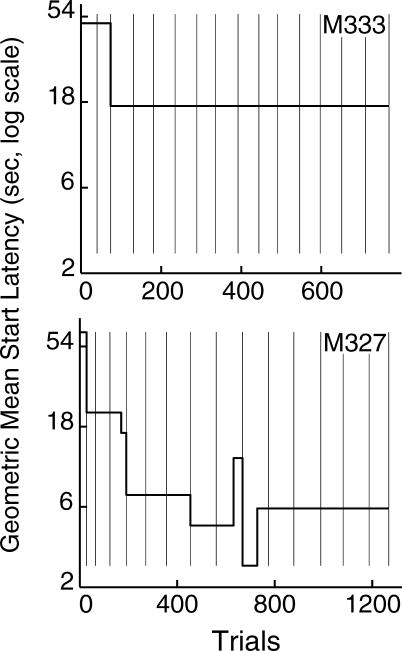
Fig 11. Slope plots of the cumulative logs of trial-initiation latencies for two mice, as reported by the algorithm with Criterion 6.
The arithmetic means of the log trial-start latencies of each segment of the cumulative records (that is, the slopes of these plots) have been converted into seconds and plotted on the y-axis as geometric means of the raw trial-start latencies.

