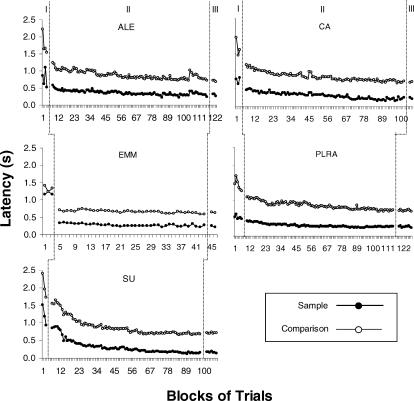
Fig 3. Mean response latencies to sample (filled circles) and comparison stimuli (open circles) in blocks of AB and AC baseline trials.
The leftmost isolated set of lines shows latencies from Phase I, third step, the middle set shows latencies from Phase II, and the rightmost set shows latencies from Phase III. Roman numerals identify phase numbers. See text for details.

