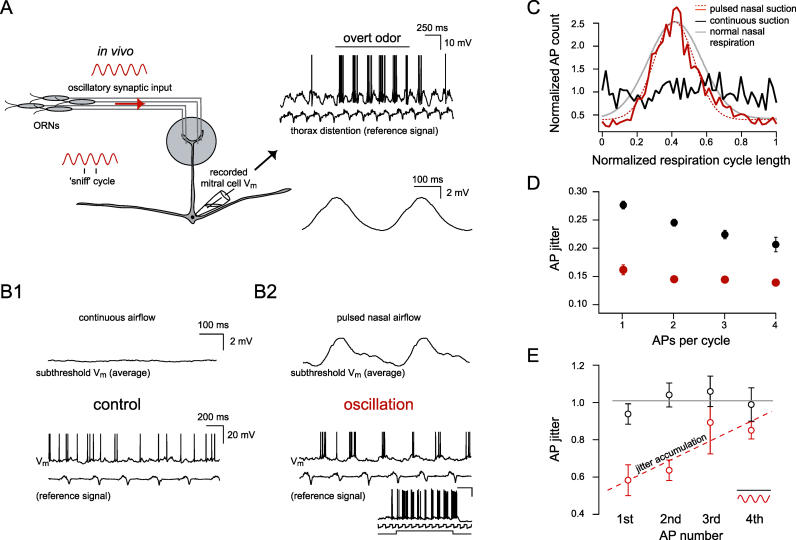
Figure 1. Synaptically Driven Oscillations Optimize AP Precision In Vivo.
(A) Schematic of the rodent olfactory receptor neuron (ORN) projection to a glomerulus in the olfactory bulb illustrating that oscillatory sensory input is coupled to the “sniff cycle” (inset, lower left). An example trace (top right) of a whole-cell recording from a representative mitral cell in a freely breathing mouse showing network-evoked oscillations in membrane potential due to background room-odor and overt odor (black line) stimulation. At the time indicated by the black horizontal bar, an overt odor stimulus (0.1% amyl acetate) evoked AP discharge. The simultaneously recorded thorax distention signal is shown directly underneath. Below an average trace is displayed, showing the subthreshold theta oscillation in the freely breathing preparation (traces averaged with respect to the thoracal breathing cycle [ 37]).
(B1 and B2) Average of subthreshold voltage traces showing that the inherent oscillatory membrane potential in the freely breathing animal can be abolished and reproduced in a tracheotomized preparation. Below are single example traces showing that continuous airflow through the nose removes the MPO (B1), whereas pulsed nasal airflow (triggered by the thorax signal) mimics the subthreshold oscillatory drive and controls spike timing (B2). The inset shows an example of an overt odor-evoked response in the tracheotomized preparation. From top to bottom: membrane voltage recording (scale bars are 20 mV and 500 ms), nasal suction, and odor valve opening. Odor presented was 10% hexanol. In the constant airflow case, positive constant current was injected to evoke approximately the same number of APs per thoracal breathing cycle.
(C) Overlapping histograms of AP times for continuous and pulsed airflow. Overlaid is the Gaussian fit of the pulsed airflow case (dashed red trace, n = 3 animals) and the freely breathing case ( n = 7, gray trace).
(D) AP precision was determined by combining respiration cycles with the same number of APs and quantified by measuring the average distance of each AP to the mean AP time. The mean distance (“AP jitter”) is measured relative to the thorax signal and plotted as a function of the number of APs per cycle. Pooled data from n = 3 cells showing AP precision for the oscillation (red) and nonoscillation case (black). Lower values of the jitter indicate higher precision (plotted is the mean ± SEM).
(E) AP precision data from the same experiments as in D, but normalized (gray lines) to the nonoscillation case for the first, second, third, and fourth AP within each oscillation cycle. Dashed line (red) is a linear fit to the oscillation data points. Note the jitter accumulation with AP number within an oscillation cycle for the synaptically driven oscillation.

