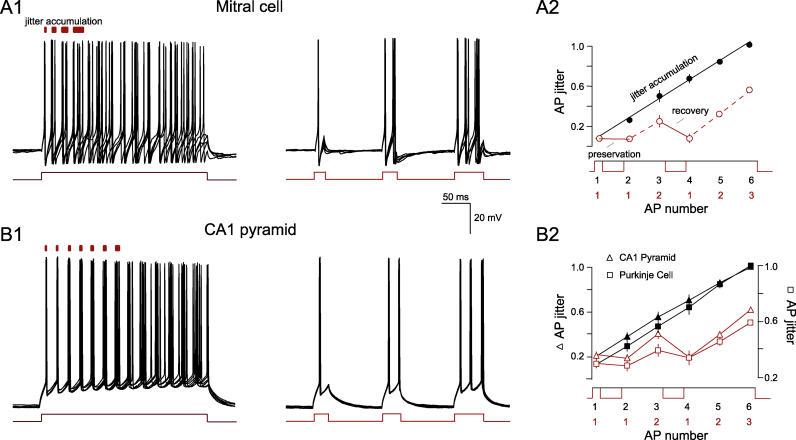
Figure 3. Membrane Potential Hyperpolarization Recovers AP Precision.
(A1) Five overlaid consecutive traces of the membrane voltage of a representative mitral cell in response to a long current injection that elicited an AP train of increasing imprecision. Red bars (above) indicate increasing AP jitter accumulation with time. (Right) Five voltage traces from the same cell where spiking is interrupted by 100-ms hyperpolarizing pulses, thus imitating oscillations with one, two, and three APs. Current pulse amplitude is 250 pA.
(A2) The mean ± SEM of the AP jitter from recordings with (red) and without (black) intermittent hyperpolarizing pulses plotted against AP number. Each data point is normalized to the jitter of the sixth spike. AP precision is fully preserved or recovered by the hyperpolarizing intervals ( n = 11).
(B1) Five overlaid consecutive traces of the membrane voltage of a representative CA1 pyramidal cell in response to a long current injection that elicited an AP train of increasing imprecision. Red bars (above) indicate increasing AP jitter accumulation with time. (Right) Five voltage traces from the same cell where spiking is interrupted by 100-ms hyperpolarizing pulses, thus imitating oscillations with one, two, and three APs. Current pulse amplitude is 300 pA.
(B2) The mean ± SEM of the AP jitter from recordings with (red) and without (black) intermittent hyperpolarizing pulses plotted against AP number. Each data point is normalized to the jitter of the sixth spike. AP precision is fully preserved or recovered by the hyperpolarizing intervals (CA1 pyramids, triangles, n = 5, left axis; and Purkinje neurons, squares, n = 3, right axis).

