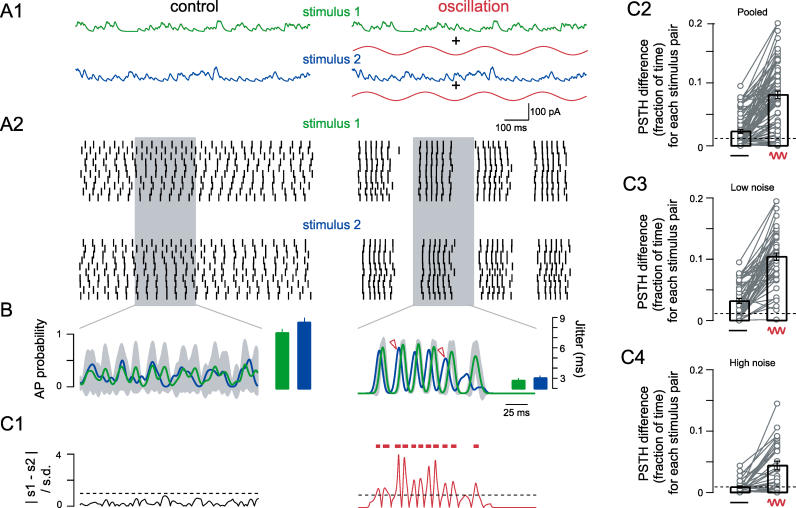
Figure 5. Oscillation-Mediated AP Precision Permits Separation of Stimulus-Specific Spike Trains In Vitro.
(A1) Stimuli (with the addition of randomly seeded noise, not shown) were evoked in CA1 pyramidal cells via the recording pipette in the absence and presence of an oscillation.
(A2) Example raster plots show ten repetitions for two different stimuli with and without MPOs.
(B) The normalized PSTH was calculated by averaging the ten smoothed (Gaussian filter; σ = 5 ms) spike trains shown in (A) and is plotted for stimulus 1 (green) and stimulus 2 (blue) separately (ordinate axis shown on left). Gray indicates the variance of the PSTH for stimulus 1 (SD of the ten [smoothed] repetitions shown in A2). Bar graphs show the overall AP precision for the entire stimulus period and both stimuli (ordinate axis far right).
(C1) A PSTH difference plot showing the difference between the mean PSTHs corresponding to the two stimuli normalized to the variance (red bars indicate where the two stimulus-evoked spike trains can be separated because the normalized PSTH difference is larger than 1, dashed line).
(C2) Population data showing temporal separation of all pairs of stimuli. Values given are the fraction of time the normalized PSTH difference was larger than 1 (e.g., red bars in C1, n = 7 cells, n = 77 stimulus pairs).
(C3 and C4) PSTH differences separated based on the amplitude of injected noise (low σ = 0.1–0.2 mV, n = 3 cells, 48 stimulus pairs; high σ = 0.3–0.5 mV, n = 4 cells, 29 stimulus pairs). Dotted line indicates chance level.

